Last updated: July 29, 2026
By accessing or using Actual Currents ("the Service"), including our website at actualcurrents.com and our mobile applications, you agree to be bound by these Terms & Conditions. If you do not agree, please do not use the Service.
Actual Currents provides tidal current predictions and visualizations based on oceanographic models. The Service includes free features and an optional paid subscription ("Unlimited"). We reserve the right to modify, suspend, or discontinue any part of the Service at any time.
Actual Currents is an aid to navigation and passage planning. It is not a substitute for official nautical charts, tide tables, or professional maritime advice, and a prudent navigator never relies on any single source of navigational information. Follow local requirements for charts and equipment, be prepared for loss of service, battery, or GPS, and always exercise sound judgment when making decisions that affect safety on the water.
Tidal current predictions are generated from harmonic models and may not account for all real-world conditions including but not limited to:
We make no warranty regarding the accuracy, completeness, or reliability of any data or predictions provided through the Service.
Some features require creating an account via our authentication provider (Clerk). You are responsible for maintaining the security of your account. Any content you submit through the Service (including logs and photos) remains yours, but you grant us a license to store and display it as part of the Service.
Free Tier: All core features are available for free with predictions limited to ±3 hours from the current time. No account is required for the free tier.
Unlimited ($4.99/month or $39.99/year): Removes the free tier’s time limits: view current and tide predictions for any date and time, past or future. Includes a 7-day free trial where offered. Requires an account.
Legacy Pro tier: The Pro tier is no longer offered to new subscribers. Existing Pro subscriptions remain active at their original price for as long as the subscription is maintained.
You agree not to:
All content, design, code, and data models comprising the Service are the property of Actual Currents or its licensors. You may not reproduce, distribute, or create derivative works from any part of the Service without written permission.
To the fullest extent permitted by law, Actual Currents and its officers, employees, and affiliates shall not be liable for any indirect, incidental, special, consequential, or punitive damages arising from your use of or inability to use the Service. This includes, without limitation, damages for personal injury, property damage, lost profits, or data loss.
You agree to indemnify and hold harmless Actual Currents from any claims, damages, or expenses arising from your use of the Service or violation of these Terms.
We may update these Terms from time to time. Continued use of the Service after changes constitutes acceptance of the updated Terms. We will make reasonable efforts to notify users of material changes.
These Terms shall be governed by and construed in accordance with the laws of the Commonwealth of Massachusetts, without regard to conflict of law principles.
Questions about these Terms? Contact us at info@actualcurrents.com.

Last updated: July 29, 2026
Actual Currents ("we", "us", "our") respects your privacy. This Privacy Policy explains what information we collect, how we use it, and your choices regarding that information when you use our website at actualcurrents.com and our mobile applications (collectively, "the Service").
Information you provide:
Information collected automatically:
Information we do NOT collect:
We use the information we collect to:
We use the following third-party services to operate the Service:
We do not sell, rent, or share your personal information with third parties for marketing purposes.
Your data is stored on secure servers hosted in the United States (AWS). We use industry-standard security measures including:
However, no method of transmission or storage is 100% secure, and we cannot guarantee absolute security.
Depending on your location, you may have the right to:
To exercise any of these rights, contact us at info@actualcurrents.com. We will respond within 30 days.
If you are a California resident, you have additional rights under the California Consumer Privacy Act (CCPA):
Actual Currents does not use tracking cookies. We use Plausible Analytics, which is cookie-free and compliant with GDPR, CCPA, and PECR without requiring a cookie consent banner. Clerk may use essential cookies for authentication session management.
The Service is not directed at children under 13. We do not knowingly collect personal information from children under 13. If you believe we have inadvertently collected such information, please contact us and we will promptly delete it.
We may update this Privacy Policy from time to time. We will post the updated policy on this page with a revised "Last updated" date. Continued use of the Service after changes constitutes acceptance of the updated policy.
Questions about this Privacy Policy? Contact us at info@actualcurrents.com.

Tidal predictions are computed from ADCIRC harmonic constituent databases (R.A. Luettich Jr. and J.J. Westerink; Atlantic and Pacific databases by NOAA/NOS/OCS), with harmonic analysis by TTide, a Python port of T_TIDE (Pawlowicz, Beardsley, and Lentz, 2002).
adcirc.org • ttide_py
Tide and current station predictions from CO-OPS Tides & Currents; live harbor sensors from PORTS®; weather buoys from the National Data Buoy Center; aids to navigation from the Marine Cadastre; nautical charts from NOAA ENC (not for navigation); bathymetry from BlueTopo and NCEI.
tidesandcurrents.noaa.gov • ndbc.noaa.gov • nauticalcharts.noaa.gov
Canadian current predictions from the Canadian Hydrographic Service, Fisheries and Oceans Canada.
charts.gc.ca
Wind forecasts from NOAA NCEP HRRR and NAM, and from ECMWF open data, © European Centre for Medium-Range Weather Forecasts (CC-BY-4.0). Global ocean currents from HYCOM (HYCOM Consortium / Naval Research Laboratory). Sea surface temperature from the NASA JPL MUR analysis via PO.DAAC.
ecmwf.int • hycom.org • podaac.jpl.nasa.gov
Standard basemap: CARTO vector tiles, map data © OpenStreetMap contributors (ODbL). Satellite imagery © Esri, Maxar, Earthstar Geographics, and the GIS User Community.
carto.com/attributions • openstreetmap.org/copyright • esri.com
Maps rendered with MapLibre GL JS, tiles served with PMTiles, charts drawn with Chart.js. This app is built on the work of countless open-source developers and the broader scientific community, and we are grateful for it.
maplibre.org
The NOAA name and logo are used with permission. Use of the NOAA name and emblem does not imply endorsement, approval, or recommendation of this product by NOAA, the U.S. Department of Commerce, or the United States Government. Actual Currents is not affiliated with, operated by, or sponsored by NOAA.
The panel on the right side of the screen; on a phone, tap the ☰ button in the bottom-right corner. It holds every app control: Time Control, Visualization Mode, Basemap Styles, Tools, Markers, and Display & Units. On desktop, the arrow tab on the panel edge hides and shows it. On a phone, swipe down or tap the map to close it.
The search box in the top-left corner, also available on the start screen. Type a town, harbor, or landmark, then tap a result. The map flies there and data loads on its own.
The readout in the top-left corner, under the search box. It reports conditions at the small crosshair in the center of the map: position, current speed and direction, and water depth. The values track whichever layer is active: wind speed when Winds is on, the roughness score when Rough Water Index is on, water temperature when Sea Surface Temp is on. Just pan the map; no tapping needed.
The date and time at the top of the map is the moment the map is drawn for. Tap it to open a calendar and jump to any date. Viewing days other than today requires an Unlimited subscription.
The button stack on the right edge of the map. Top to bottom: zoom in, zoom slider, and zoom out; a compass that appears whenever the map is rotated, tap it to snap back to north-up; a locate button that appears when your position is off screen, tap it to fly to your GPS spot; a bookmark that opens your saved places; and an ⓘ that opens this guide. On desktop, the ⓘ at the bottom of the settings panel opens this guide. The separate small ⓘ beside the gold Unlimited badge in the lower-left corner shows map and data credits.
Pick one in Visualization Mode in the settings panel. Exactly one layer is on at a time; tap a tile to switch. The app always starts on Currents. The Heatmap Opacity slider below the tiles sets how strongly the active layer is painted.
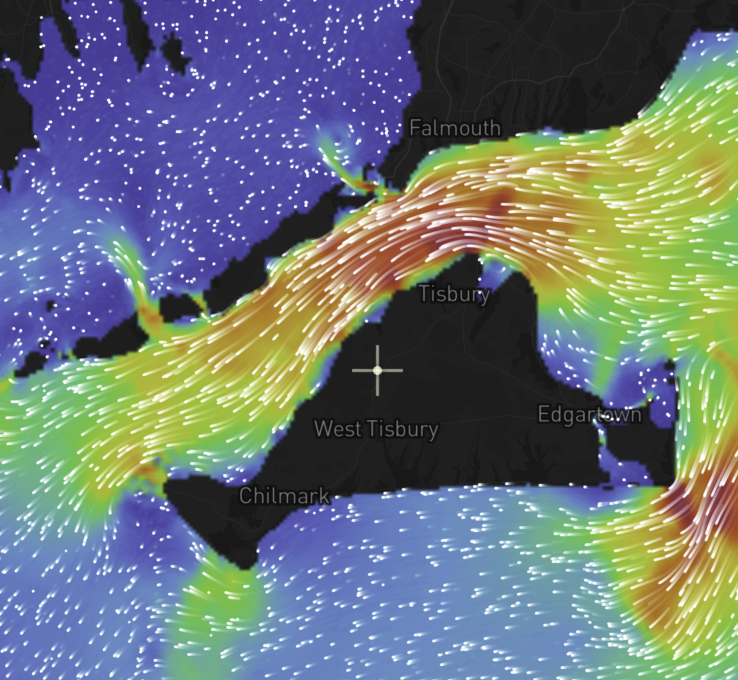
Animated particles ride the predicted tidal current, and color shows speed on the legend at the bottom. Zoom in until data loads; a hint appears if you are too far out, and fully zoomed out you see ocean-scale currents instead. Scrub the time bar to watch the flow build, turn, and go slack. A repeating NO DATA stamp means that water is outside the model, which covers US coastal waters.
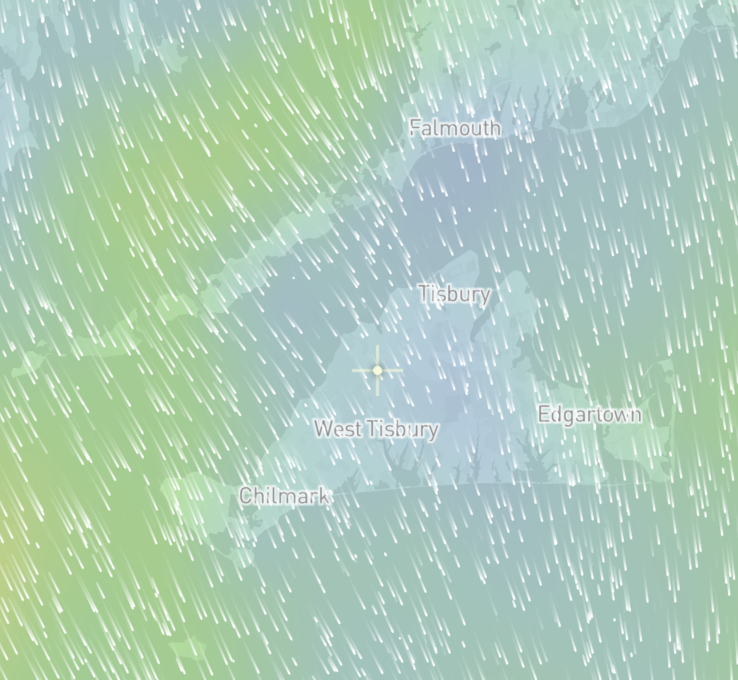
Forecast wind drawn as drifting streaks with its own 0–40 kt legend; the map brightens so the colors read. Pills under the tiles switch the forecast source: HRRR is US-only and sharpest, out to about 2 days; NAM is US-only, out to about 3.5 days; ECMWF is worldwide, out to about 10 days. Use ECMWF outside the US.
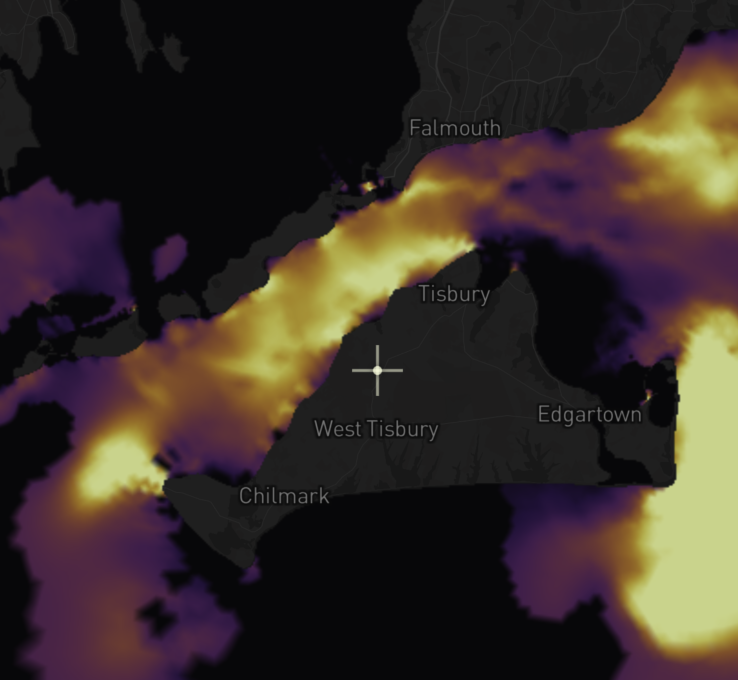
Scores the water 0 to 10 where wind blowing against current steepens the sea, the classic recipe for short, steep chop. The readout translates the number: Calm, Moderate, Rough, Very Rough, Dangerous. It has its own forecast-source pills and covers US coastal waters.
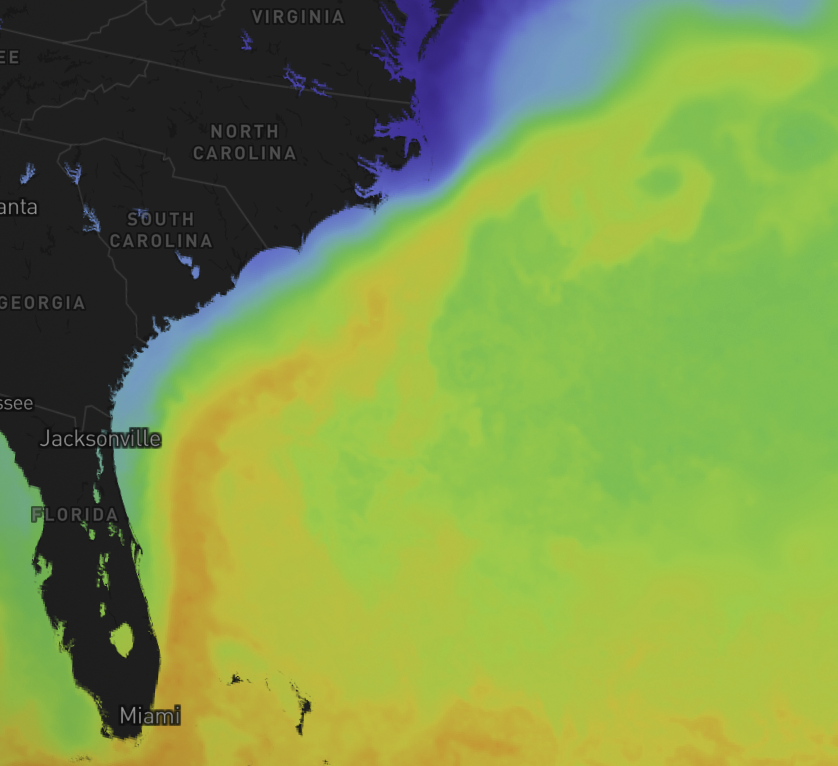
One satellite temperature image per day, useful for finding fronts, warm eddies, and cold pockets. The time buttons switch to −1d/+1d for stepping between days, and the app jumps to the newest image on its own; a message appears if a date has no image. Leaving this layer returns the clock to now.
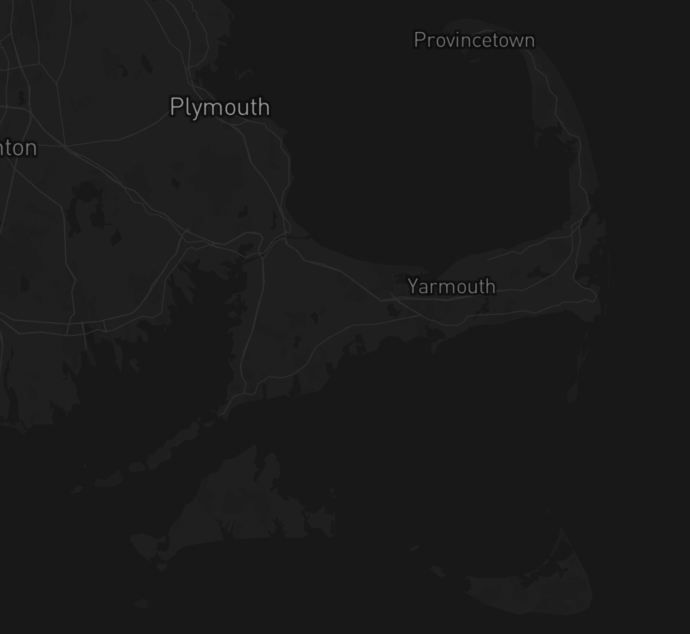
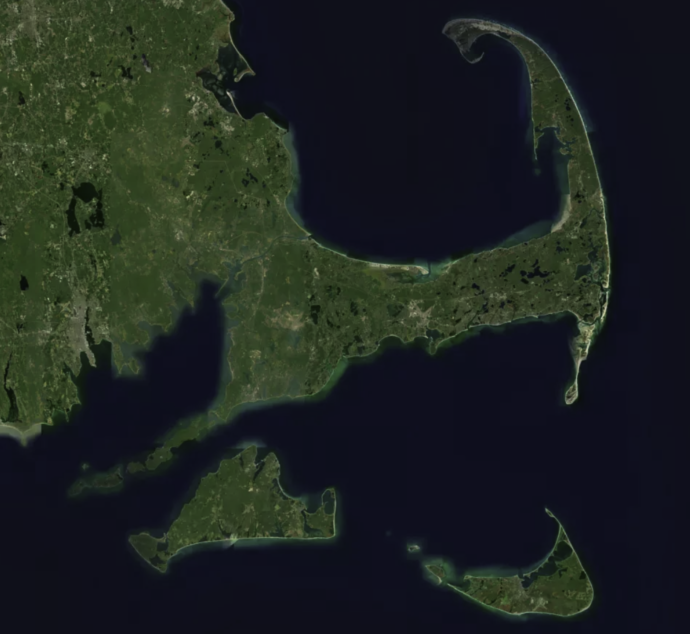
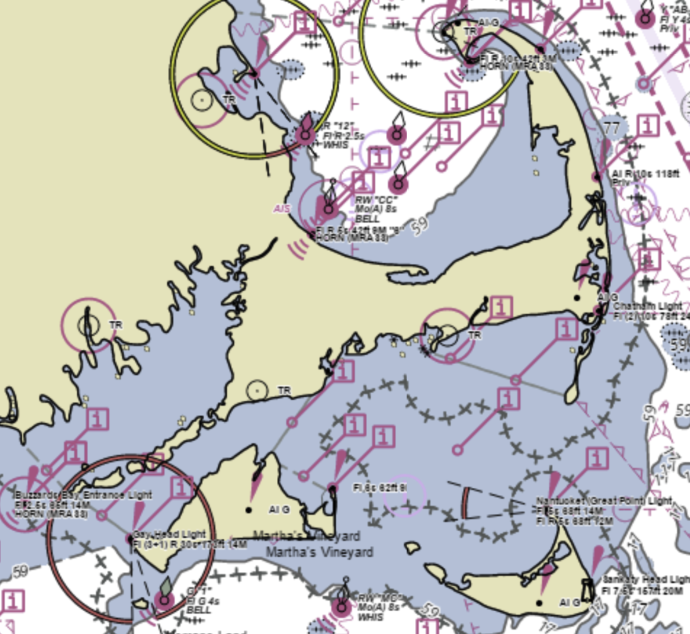
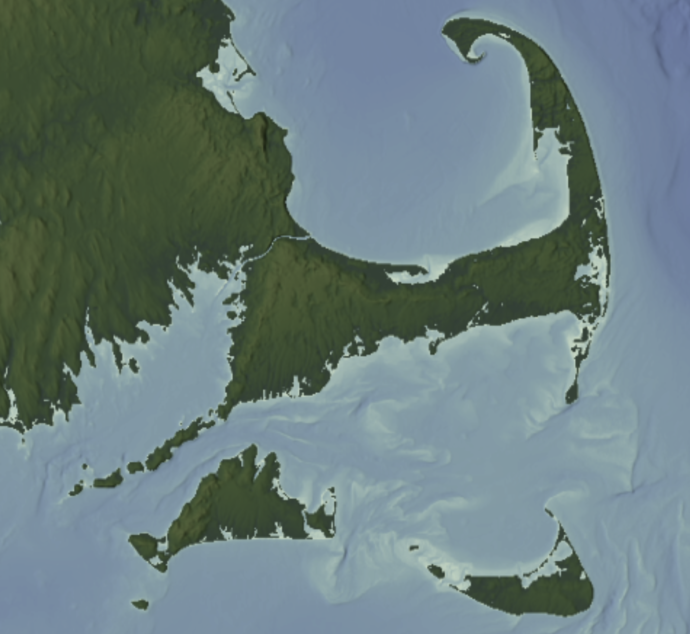
The map background, chosen under Basemap Styles. One is always on, and your data layers stay on top when you switch. Starts on Standard each launch.
A clean chart-style map drawn in dark, light, or night colors to match the app appearance.
Aerial imagery.
Official NOAA electronic charts: depth areas, contours, soundings, buoys, beacons, and hazards in standard chart symbology. The closer you zoom, the more chart detail appears. Soundings are shown in feet or meters to match your units choice. US waters only; the symbols are drawn for reference and are not tappable.
Shaded seafloor relief, worldwide. Read channels, banks, and drop-offs at a glance.
All in the Tools section of the settings panel.
The predicted current at any exact spot. 1. Tap the tool; it highlights and the cursor becomes a crosshair. 2. Tap a point on the water: a marker drops and a chart opens with 24 hours of speed and direction there; the red dashed line is the selected time and follows the time bar. 3. Tap somewhere else to move the gauge; there is one at a time. 4. Tap the tool again to turn it off, or close the chart with its ×.
The predicted water level at any exact spot. Tap the tool to arm it, then tap a point on the water: a marker drops and a chart opens with that location’s 24-hour tide curve plus the water depth at the selected time, useful where there is no official station. Tap somewhere else to move the gauge, and tap the tool again to turn it off.
Shows every official NOAA tide station as a marker. Tap a station for its published tide predictions, the same numbers as the tide tables, centered on the selected time. These are predictions, not live readings. Tap the station again or the chart’s × to close; tap the tool again to hide the markers.
Official current-prediction stations from NOAA in the US and CHS in Canada, drawn as arrows that point with the flow and animate as you scrub time. Tap an arrow for a chart comparing the official prediction against this app’s model at that spot — a good cross-check at important passages. If you have been viewing one of the app’s higher-resolution regional models, its line joins the chart too; a model with no meaningful signal at that station is left off rather than drawn flat. No arrows? Zoom in.
Live sensors in major US harbors. Tap a marker for observed water level, currents, wind, and air readings over the past 24 hours, plus about 6 hours of predictions where available. PORTS always shows real time; it does not follow the time bar.
Plan a passage through the currents. Sign-in required. 1. Open the tool and choose the route type: Place waypoints, Optimal Departure, Open saved route, or Upload .gpx (on desktop these are the Manual / Departure / Import / Saved chips). 2. Tap the map to drop waypoints in order; drag any waypoint to adjust. To check a waypoint’s distances or delete it, open its card (desktop) or press and hold the waypoint on the map (phone). 3. Enter your boat speed. 4. Set the departure time in the Departure field beside the speed input. 5. Tap Compute Route: a panel opens with depart, arrive, and transit time plus current, wind, and rough-water charts along the way, and the map and time bar jump to your departure time. 6. Drag on the charts to slide your boat along the track and the map follows. The expand button in the panel’s top corner switches between one chart at a time and all charts at once. The arrow in the panel’s top-left corner goes back to editing: your waypoints stay on the map, so adjust the speed or departure time and compute again. 7. Save with the disk icon; reopen later from the Saved chip (desktop) or Open saved route (phone), where the trash icon on a row deletes a saved route. The panel’s × closes the tool.
Finds the departure with the shortest transit. On desktop, choose the Departure chip in the route panel; on a phone, choose Optimal Departure when opening the route tool. Place waypoints and enter your speed as usual, pick a window of ±2 to ±6 hours around the departure time, and tap Find Optimal Departure. The app times the passage at every 15-minute departure in the window, then opens the route panel at the best departure with a Saved stat showing the minutes gained, and moves the map clock to match. The top chart plots transit time against departure time: the green dot is the fastest departure, the bracket shows the minutes it saves over your rough departure, and dragging along the curve previews any other start; release to load that plan.
Bookmarks for map views. Sign-in required. Open the tool, tap Save current view, and name it. A crosshair pin then drops on the map: drag it onto the current you care about — the live readout under it previews that spot — and tap Save gauge. That gauge point is where the place reports live conditions from; Skip saves the place without one. Tap a saved place in the list to fly back to it. Each row has four controls: the ☰ handle drags to reorder the list (this is also the order on the start screen), the crosshair sets or adjusts the gauge point (blue once set), the house makes it your Home, and the trash deletes. On a phone, the bookmark button on the map opens the same list. Saved places follow your account to every device.
On the start screen, Saved opens a live dashboard of your places drawn over a quiet map of their surrounding waters. The open card shows conditions at its gauge point right now: a large arrow pointing where the water is flowing — sitting exactly over that spot on the map behind it — with the speed, the next slack time, and a tide curve marking now and the coming high or low. The tide curve shows timing and shape only, never heights. Swipe up or down on the card (or tap another place in the list) and the view fades to the next spot; View on map opens the app there. A place without a gauge point shows a hint instead of readings — set one from the Saved Places tool.
A live dashboard for when you are underway; location access required. GPS position, speed, and heading on a compass dial, plus Current Effect, the predicted current along your heading, green when it pushes you and red when it is against you. iPhones may also ask for motion access for the compass. Close with the ×.
Record your actual track. Sign-in required. Tap New Trip, then ▶ to start recording. ❚❚ pauses, and while paused that button becomes Stop & Save. Name the trip and save; it opens in review with current, wind, and rough-water charts along your track. Drag on them to replay the trip. Reopen anytime under Saved Trips; the × on a row deletes it immediately.
A logbook pinned to the map. Sign-in required. Tap New Log: add a title (required), notes, and a photo from camera or library. Position is your GPS spot by default, with the current there captured automatically, or tap Choose on Map and pick the spot yourself. In a saved log: Add to Personal Map pins it to a map only you see, Add to Public Map shares it with every user, and Delete asks before removing.
On/off switches in the Markers section of the settings panel.
Real buoys, beacons, and lights drawn with proper chart shapes and colors, on any basemap. Zoom in: lights show first, buoys and beacons closer in, names and light characteristics closer still. US waters. Drawn for reference; they are not tappable.
Pins for the log entries you have added to your personal map. Tap a marker to open the log. Visible only to you; sign-in required.
Log entries the community has published. Anyone can browse them, signed in or not. Tap a marker to read; other people’s logs are read-only.
Live offshore buoys from the NDBC network. Tap one for its latest report: wind, gusts, waves, air and water temperature, pressure. Latest reading only; buoys do not follow the time bar.
Everything on the map is drawn for one moment, and the bar at the bottom of the screen chooses it. The line at the center of the bar is the selected time: drag the bar and the timeline slides underneath the line, and you can keep dragging to roll hours or days into the past or future; the date appears at each midnight so you always know what day you are on. Tap anywhere on the bar to bring that time under the line, and an amber tick marks the real present. You can also step ±1 hour with the arrow buttons (±1 day on Sea Surface Temp), tap the time field to type an exact date and time, or use Jump to Now in the settings panel to snap back to the present. Free accounts view today, about ±3 hours around now; the PRO-marked stretches of the bar and other calendar days require an Unlimited subscription.
The pill rows near the bottom of the settings panel. These choices are remembered on your device, and follow your account everywhere when you are signed in.
Dark, Light, or Night. Night redraws the map and data in reds only, to protect night vision at the helm.
Particles animates the flow; Arrows shows a fixed field of vectors for a traditional chart look.
A latitude/longitude grid over the map. Major and Minor are separate switches; tap each on or off, or stack both. Off clears them.
Fixed uses one 0–5 kt palette everywhere. Auto stretches the palette to the fastest water in view so gentle flows stay visible. The legend updates to match, and its floor lifts (≤) when there is no slack water on screen.
Units sets Imperial (feet, °F) or Metric (meters, °C) for depths and temperatures. Speed is its own switch, kts or the land unit — shown as mph with Imperial units and km/h with Metric — so you can keep metric depths and still read knots. Distances follow the speed choice: nautical miles with kts, statute miles with mph, kilometers with km/h.
Shows every time in the app in a 12-hour or 24-hour clock: the main clock, the time bar, route and trip times, and station charts.
Tap the person icon at the bottom of the settings panel to sign in with Apple, Google, or your email. An account is free. It unlocks Routes, Saved Places, Trips, and Logs, and keeps your routes, trips, logs, saved places, and settings in sync on every device. Signing out removes that synced data from the device.
Real-time analysis is free and fully featured. Unlimited removes the time limits: view currents and tides for any date and time, past or future, to plan next weekend’s passage or replay last month’s ebb. Monthly or annual, with a 7-day free trial. The gold Unlimited button in the lower-left corner of the map opens the details. Already subscribed? Open the panel and use Sign in / Restore purchases.
Our predictions begin with ADCIRC (Advanced Circulation), a high-resolution ocean model developed at UNC and Notre Dame, widely used by NOAA and the US Army Corps of Engineers. ADCIRC solves the shallow water equations — the fundamental physics of how water moves — on an unstructured triangular mesh of over 2 million nodes.
The shallow water equations describe three things: conservation of mass (continuity) and the balance of forces in two horizontal directions (momentum). Here are the full equations:
i. The full shallow water equations
ii. Simplify for a tidal-only simulation
No weather forcing: atmospheric pressure gradients and wind stress drop out.
iii. Rearrange to solve for velocity over time
The raw time series above is accurate but impractical — gigabytes of data that only covers the simulated period. To make predictions for any date, we need to extract the underlying tidal patterns.
A harmonic analysis is performed on each node's time series. Because the tidal frequencies are known precisely from astronomy, a least-squares method can decompose the complex signal into its individual wave components:
This is similar to how a prism splits white light into its component colors — the complex tidal signal is split into its component waves. The result at each node is a set of amplitudes and phases that compactly encode the full tidal behavior.
Each constituent corresponds to a specific gravitational cycle of the Moon and Sun. Together they capture the dominant patterns in tidal currents — like individual notes that combine to form a chord.
The 8 constituents extracted at every mesh node:
M2 — Principal lunar (12.42h period) — the dominant tide
S2 — Principal solar (12.00h)
N2 — Larger lunar elliptic (12.66h)
K1 — Luni-solar diurnal (23.93h)
O1 — Principal lunar diurnal (25.82h)
P1 — Principal solar diurnal (24.07h)
M4 — Shallow water overtide of M2 (6.21h)
M6 — Shallow water overtide of M2 (4.14h)
At each mesh node, ADCIRC provides the amplitude and phase of every constituent for both the east-west (U) and north-south (V) current components.
To calculate the current at a specific moment, we use harmonic synthesis — summing the contribution of each constituent separately for the east-west (U) and north-south (V) components:
The astronomical calculations (V, u, f) are computed using the TTide library, which tracks the precise positions of the Moon and Sun for any date.
The result is a U (east-west) and V (north-south) velocity at every mesh node. These velocities are then:
• Converted from m/s to knots
• Interpolated across triangles using barycentric coordinates so particles can flow smoothly between nodes
• Visualized as animated particles that follow the current — faster flow means faster, brighter particles
Because tides are driven by celestial mechanics, they are highly predictable. This app can calculate accurate current predictions for any date — past or future — at any of the 2 million+ points in the mesh.
However, predictions do not account for wind, storms, river discharge, or other non-tidal forces that can temporarily alter currents. Always consult official sources for navigation.
Logs are tied to your account so you can read and edit them from any device and optionally share them publicly.
Are you sure you want to delete this log?
Unlimited